Everything You Need to Know about Twitter’s New Analytics Dashboard

Back in July, Twitter rolled out a new analytics dashboard that was at the time limited to advertisers, publishers using Twitter cards & verified users. Today, Twitter is making the ‘Tweet Activity Dashboard’ available to (almost) everyone.
The new tweet analytics dashboard can be accessed at analytics.twitter.com using your regular Twitter username and password. It is possible that you won’t see data for all of your previous tweets in the report, Twitter mentioned that the impression and engagement data will populate after your first time using the dashboard. From there, all impression and engagement metrics will be updated in real time.

Who can Use Twitter’s Tweet Activity Dashboard?
Twitter’s Tweet Activity Dashboard is available to users tweeting primarily in English, French, Japanese or Spanish who have an account older than 14 days. Twitter says that the language and account age restriction should be lifted in the future.
In order to be able to use the new analytics dashboard, your account cannot be restricted or protected, and also needs to be active (suspended account or deleted account can’t access the dashboard).
Lastly, accounts that do not follow Twitter’s Ads policies will be prevented from using the new analytics dashboard.
How to Use Twitters’ Tweet Activity Dashboard?
Twitter’s new analytics dashboard includes 3 different sections: tweets, followers and twitter card.
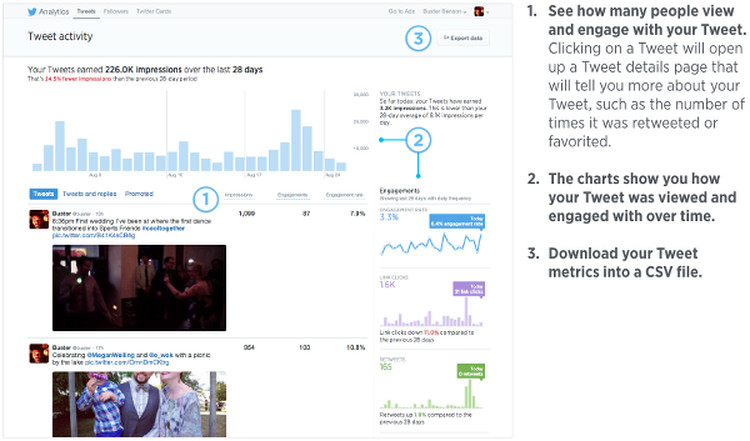
The first section, ‘Tweet’, allows you to keep track of the impressions, engagement and engagement rate for each of your tweets. When clicking on an individual tweet, you are able to view detailed metrics, including (but not limited to):
- A preview of your tweet
- A graph of the impressions over the first 24 hours
- Total impression
- Replies
- Retweets
- Favorites
- Click on links
- User profile clicks if you included a @handle
- Number of clicks to expand the tweets to view more details
- Shares by email
Below is a preview of how the dashboard works in the tweet section:

The second section, ‘Followers’, includes the following elements:
- Graph showing the evolution of your follower count overtime (at least for the last 2 years)
- Summary of the most unique and most popular interests of your followers
- Summary of the top locations of your followers, by countries, states and cities
- Gender repartition of your followers
- Top 10 most followed accounts by your followers
The third section, ‘Twitter Cards’, will only display data if you are already using Twitter cards (details on how to set it up can be found on Twitter’s support page). Once you are added the meta tags to the pages that you share over Twitter, the dashboard will display 3 data sets:
- URL clicks: Tweet’s card click metrics, such as the card type, individual links metrics, influencer having shared your card, and more.
- Install attempts: various metrics related to clicks to install an app via the Tweet’s card
- Retweets: various metrics related to your Tweet’s card that got retweeted
Twitters’ Tweet Activity Dashboard Best Practices
When originally announcing the dashboard, Twitter shared a few recommendations on how to best use it:
- “Pay attention to when you tweet. Note which time of day and day of the week yields the highest engagement and impressions.
- Analyze the frequency of your Tweets. Use your new insights to determine your Tweet cadence.
- Identify what Tweet mechanics work, and which aren’t as effective. Keep an eye on elements like different calls to action, the inclusion of rich media and copy length.”
Various social analytics tools actually offer these features among many more, and make this analysis a lot simpler. Get in touch with us if you would like to learn more about how to optimize your social media activities analysis and ROI measurement, or check out or digital marketing training which covers many of these topics.


